🔦Monitor what's sent
Double-confirm that your CAPI is working to your success
💡 If you haven’t enabled CAPI to overcome browser limitations, definitely check this out on how to set it up. Otherwise, you won't be able to monitor the data here.
Two Owls Dashboard - A quick glance
Dashboard is your go-to place to take a look at the overall server events sent and conversion rate funnel, store-wide.
Event Overview: Track the total number of Add to Cart, Initiate Checkout, and Purchase events successfully sent to Facebook.
Purchase Report: View detailed order data, including Order ID, value, currency, UTM parameters, and event types.
Order Details View:
Displays a comprehensive breakdown of actions for a specific order, including:
Purchase Information: Total order value, items purchased, and purchase time.
Event Activity Timeline: Details of Add to Cart events with links to the exact product pages and links to the page where events happened, providing insight into the customer journey leading to the purchase.
Search & Export: Quickly filter reports by order/event ID and download data for further analysis.
Note:
You can only look up for data no more than 60 days into the past.
The dashboard reports all server events sent, regardless of the pixel IDs.
The events are recorded at the time they happen, following the time zone you set in Event Setting.


Two Owls' CAPI analytics - A detailed look
Analytics is where you dive deeper into each pixel (with CAPI on)'s performance
👉Here's how Two Owls Analytics helps you to monitor your CAPI performance:
Real-time report: Assess how many add to cart, initiated checkout & purchase events have been successfully sent to Facebook
Conversion Rate Funnel: breakdown by pixels
Revenue: View the revenue associated with the purchases sent
Event activities chart: Visualize the volume of key events (Add to Cart, Initiated Checkout, and Purchases) over time

Need some exports?
🎉CSV Exports: Yes, we heard you. Exports are now available for both the Event Report table and Purchase Report table for more detailed analysis on your own
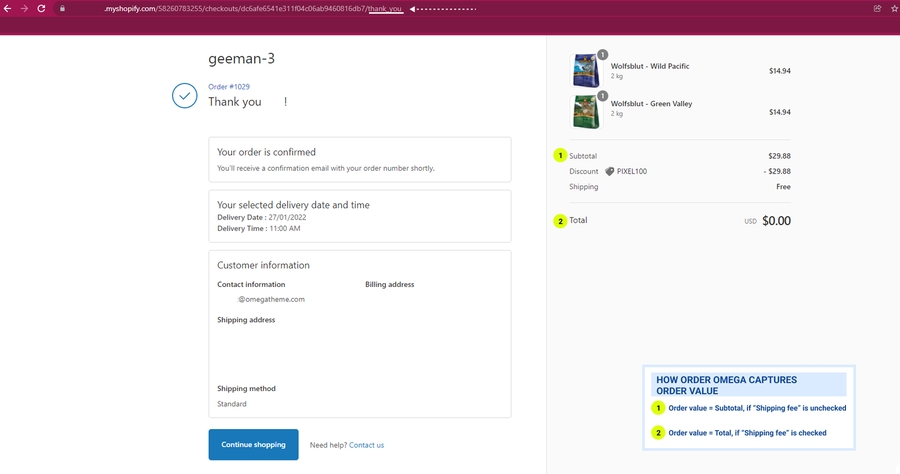
What’s included in the order value of a purchase event?
If you’ve checked “Shipping fee” in Event Setting, Omega captures what shows up on the thank_you page. It’s the total amount your customers pay for the order.
If you leave the “Shipping fee” unchecked, Omega captures only the Subtotal amount.


Hurray! Now that your tracking is all set, it's time to get yourself a competitive advantage by having access to a faster & more accurate attribution report 👇
Last updated